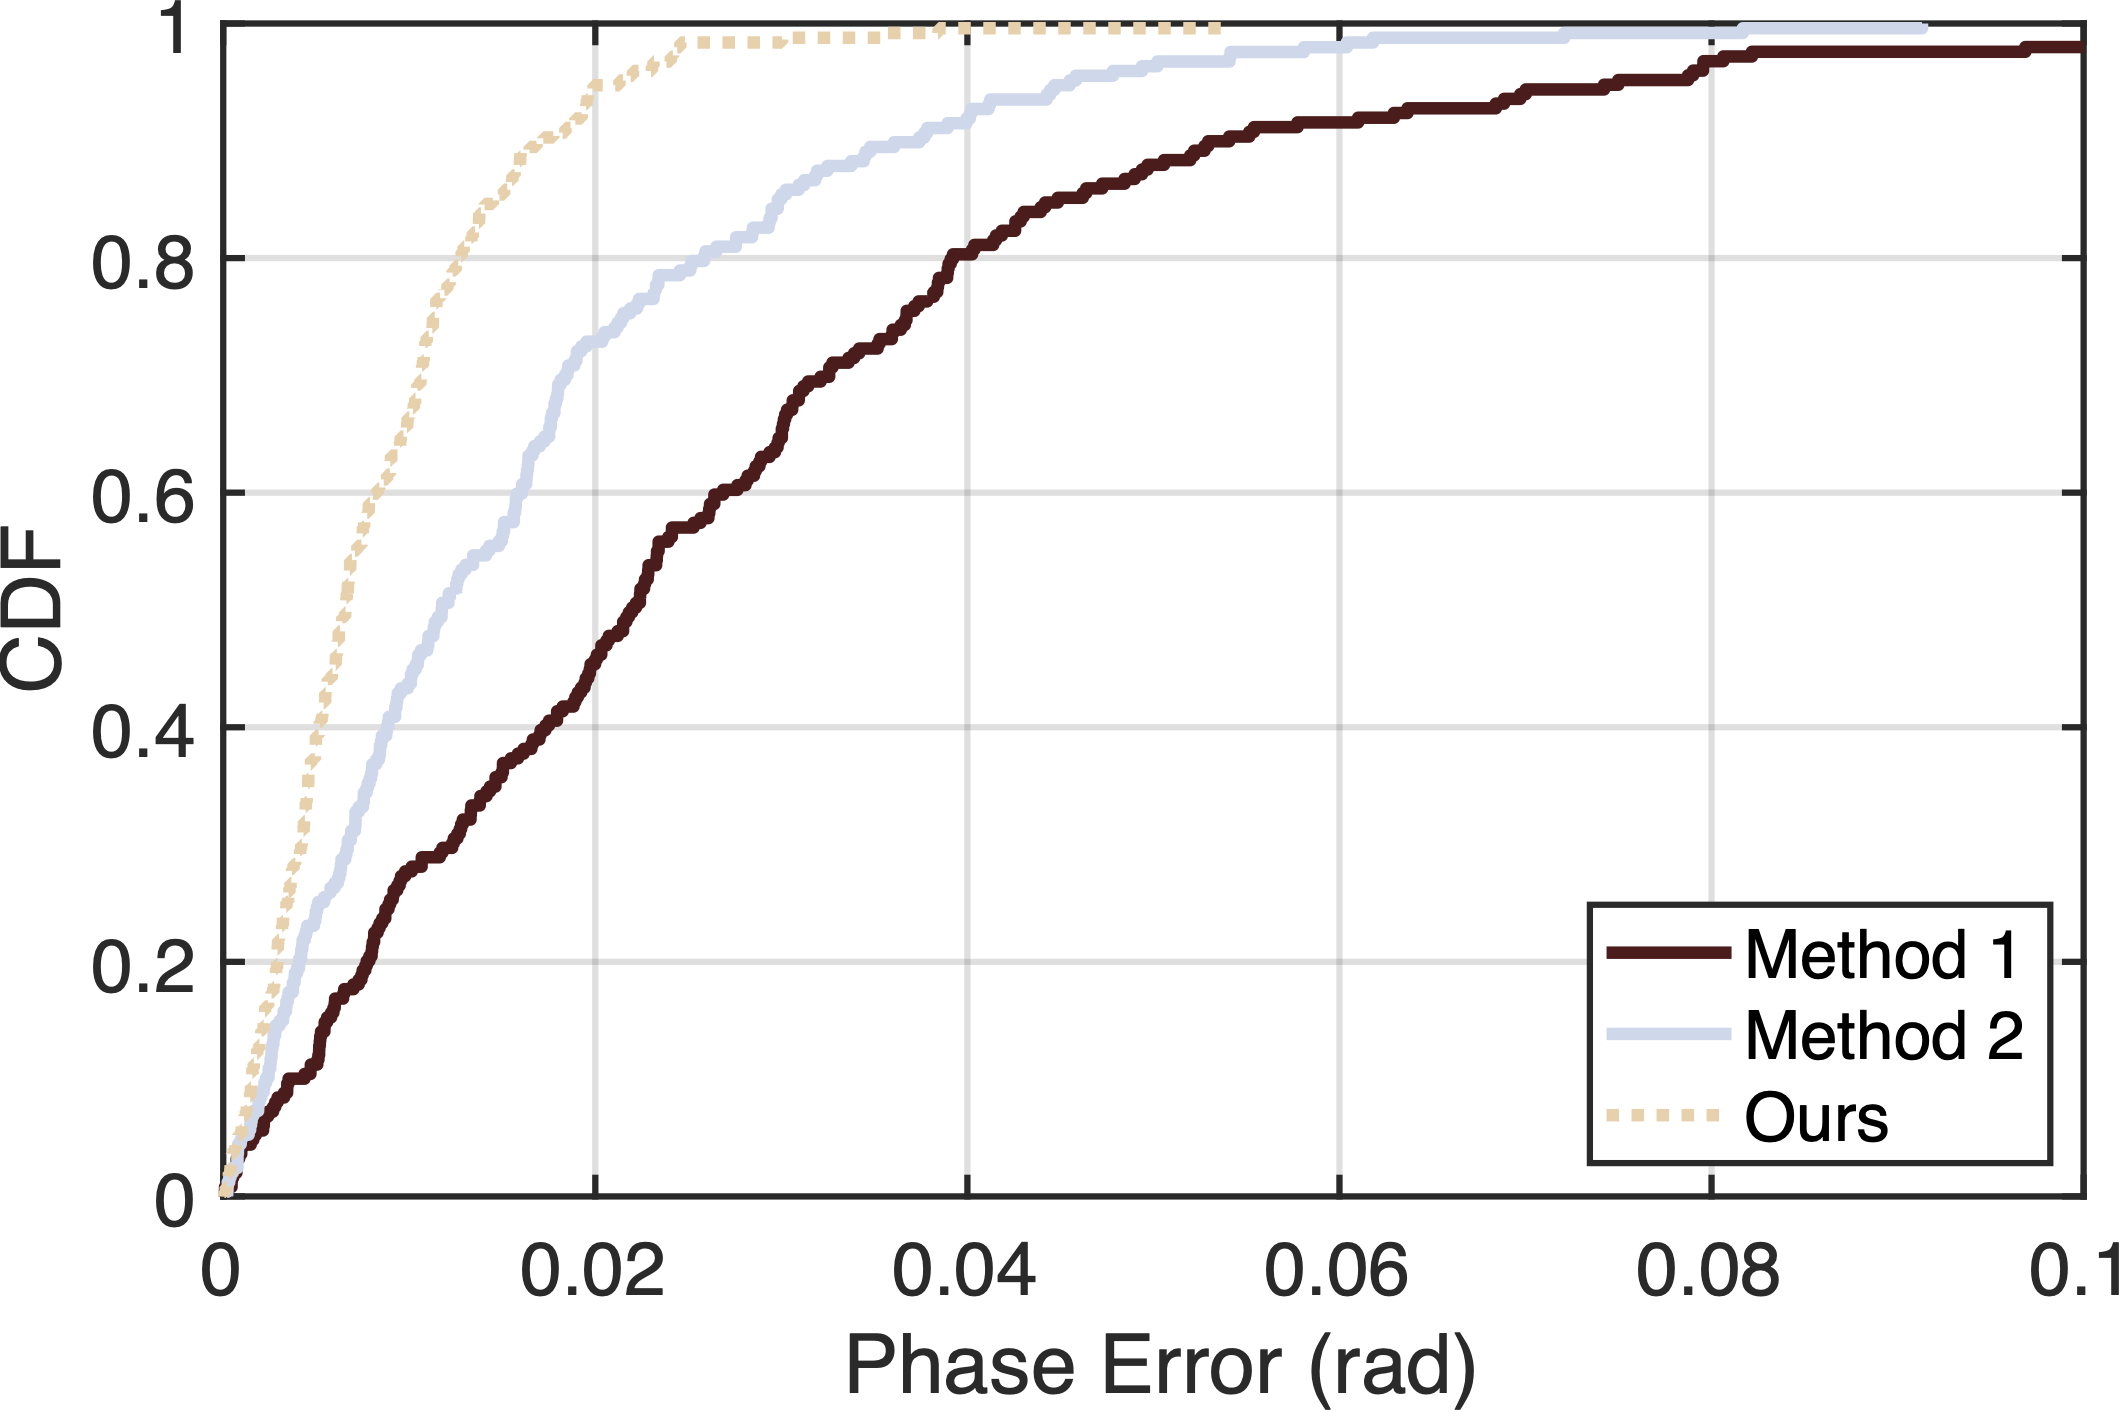
Matlab Plot
Basic settings in Matlab
Download code and data Here
clc;clear;close all;

load('data.mat');

figure;
set(gcf,'unit', 'inches', 'position', [5,5,8,5]);  % 设置图片长宽
axes('linewidth', 1.5, 'box', 'on', 'FontSize', 18); % 设置坐标轴线宽

%% 绘制三条cdf曲线
hold on;
h1 = cdfplot(m1);  %绘制cdf
set(h1, 'linewidth', 3, 'Color', [86, 21, 21]/255);  % 调整线宽,线色和线型
h2 = cdfplot(m2);
set(h2, 'linewidth', 3, 'Color', [205, 217, 235]/255);
h3 = cdfplot(m3);
set(h3, 'linewidth', 3, 'Color', [239, 210, 173]/255, 'linestyle',':');

%% 删除标题,添加legend,xlabel和ylabel
delete(get(gca,'title'))
legend('Method 1','Method 2','Ours', 'Location', 'southeast')
xlabel('Phase Error (rad)')
ylabel('CDF');
xlim([0,0.1]);

%% 导出矢量图
exportgraphics(gcf,"basic-cdf.pdf",'BackgroundColor','none','ContentType','vector')

Heatmap
clc;clear;close all;
load("data.mat");

figure;
hold on;

s = pcolor(data);
set(s, "FaceColor", "interp", "EdgeColor", "none");
% s.FaceAlpha = 0.8;

%%
axis equal;
axis off;
% colorbar;
colormap jet;
set(gca, "FontSize", 18);

exportgraphics(gcf,"heatmap.pdf",'BackgroundColor','none','ContentType','vector')
The Result is shown as follows:
